
Civic Lens
Civic Lens makes government data easy to understand and explore, helping more people stay informed and involved without needing technical skills.
Check out the project online.
Project Solution
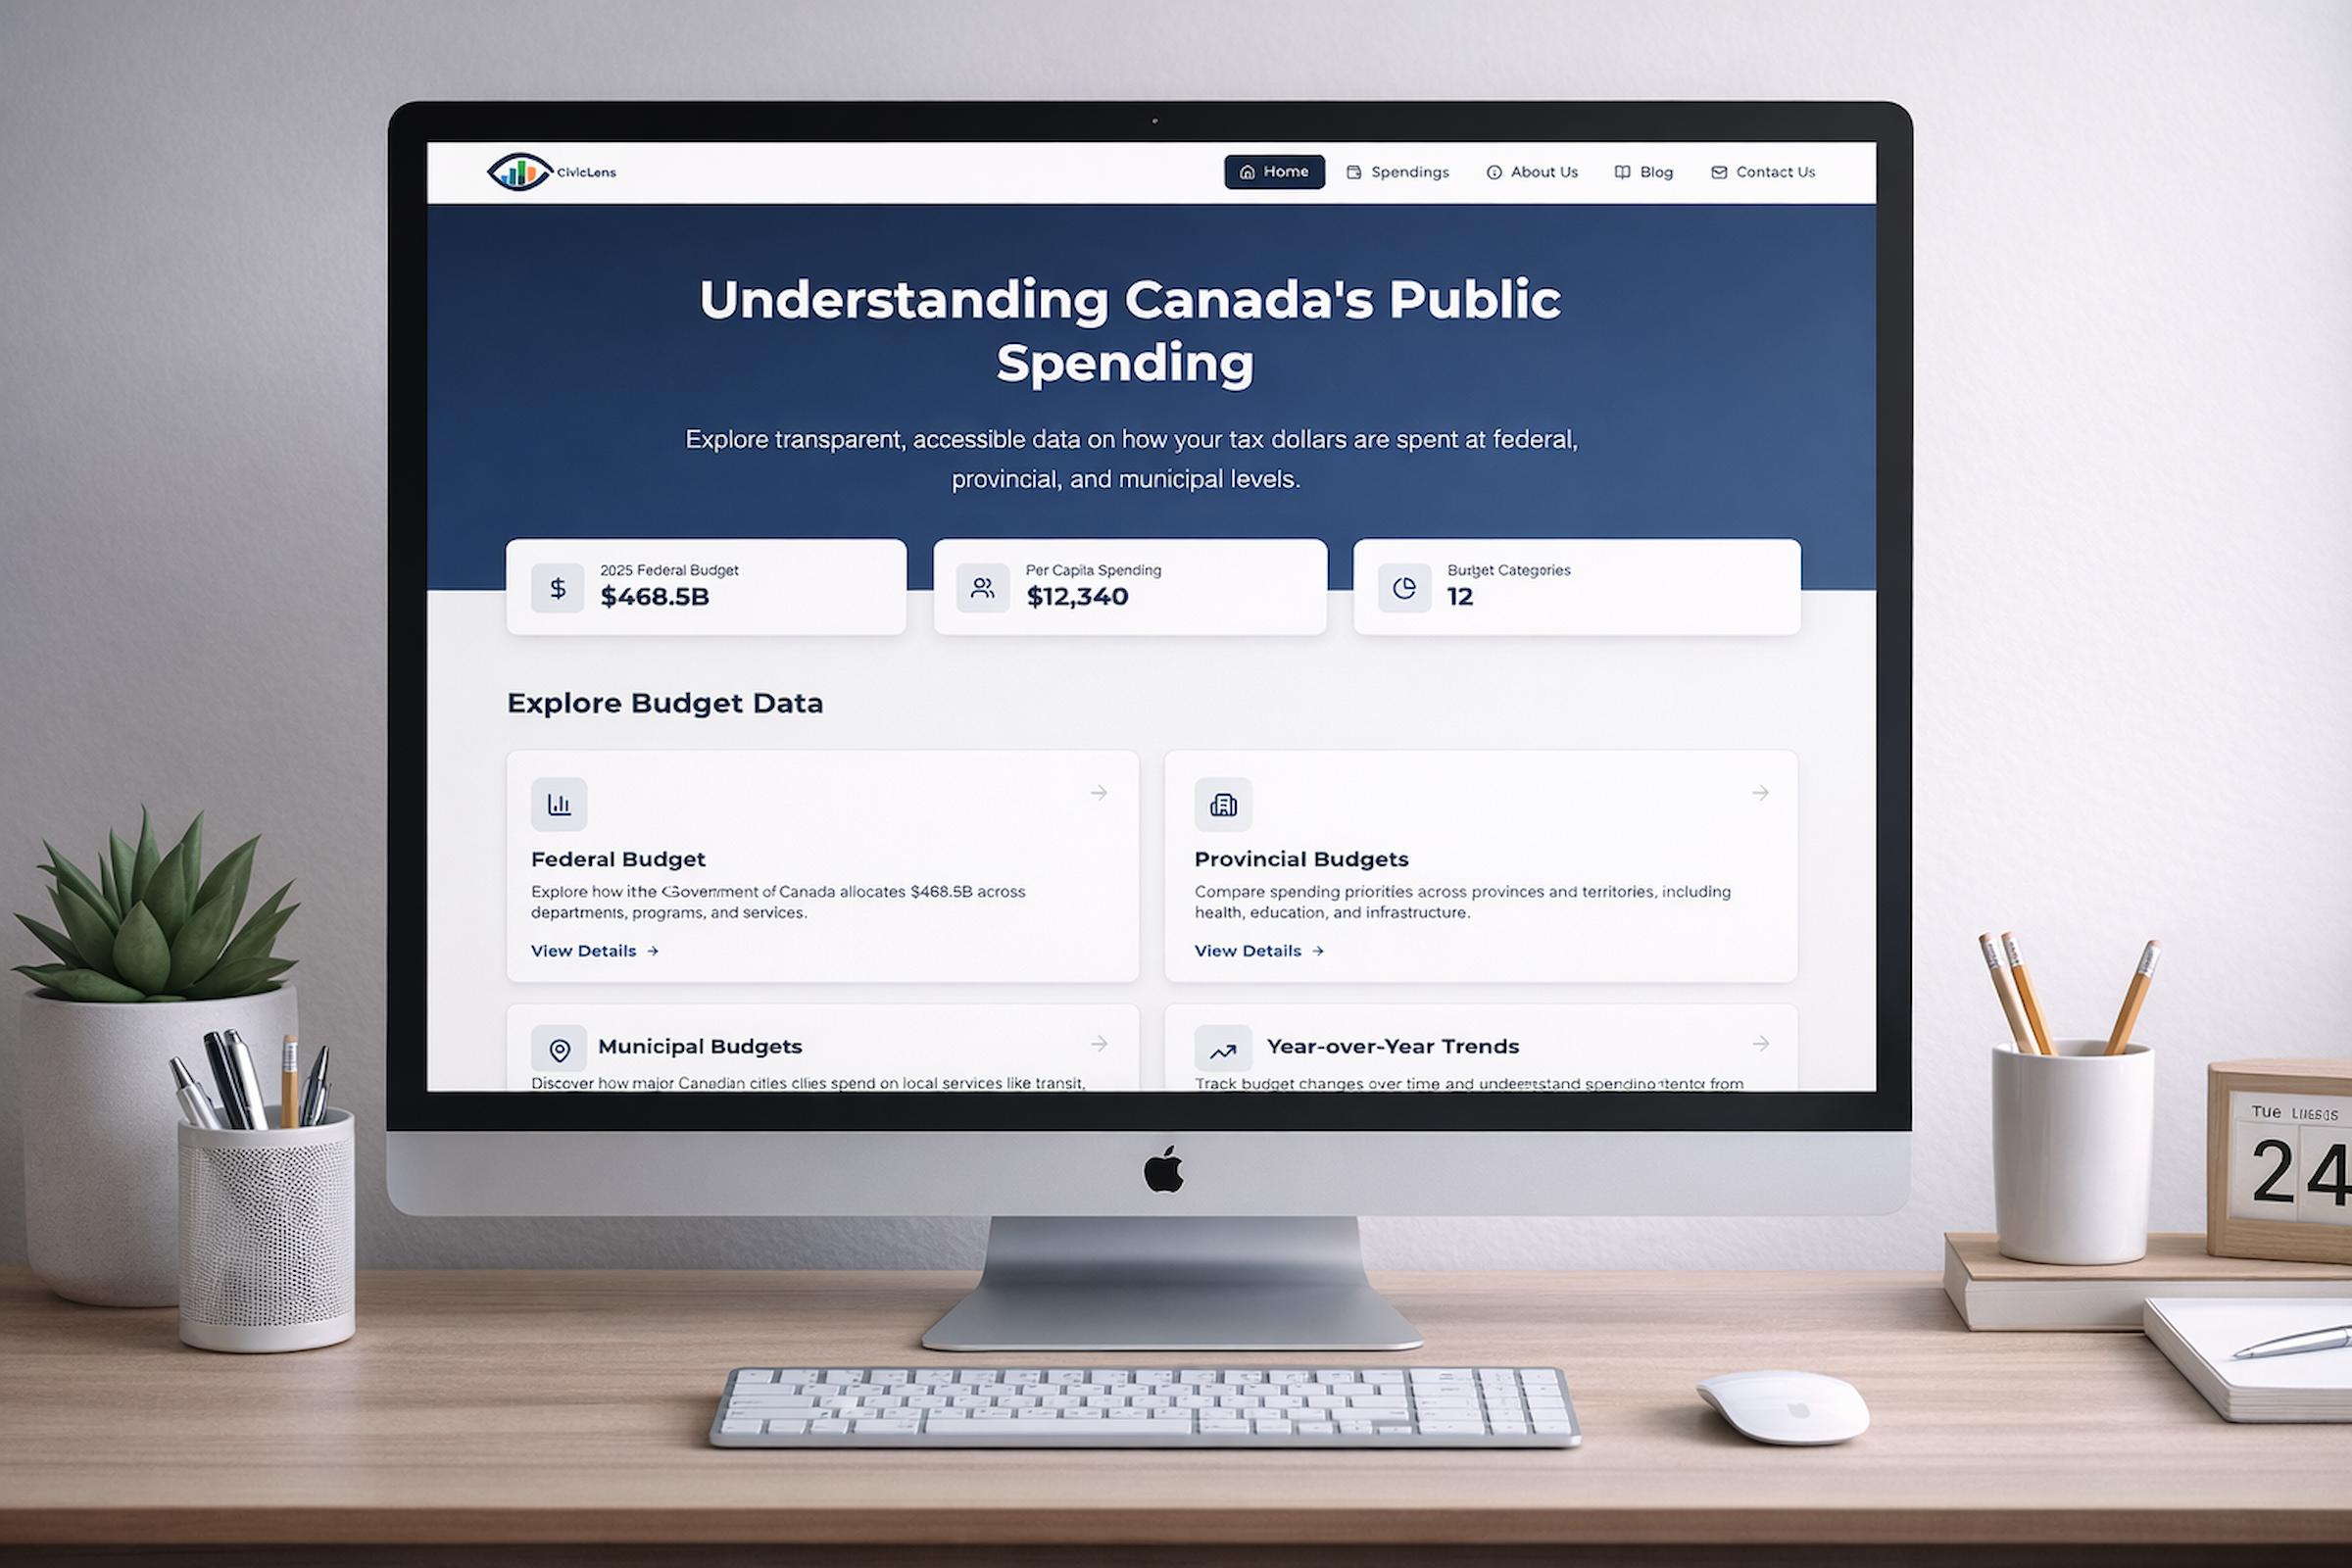
Civic Lens is a digital platform that brought together and visualized Canadian government budget data across federal, provincial, and municipal levels. The solution was developed as a user-friendly website using React, JSON, and CSS, while Figma was used during the design phase to plan and refine the interface. It included six main sections: a homepage, a federal budget breakdown, provincial comparisons across 12 provinces and territories, municipal spending analysis in major Canadian cities, year-to-year comparison tools, and an “about” page. Data visualization dependencies such as lucide-react, recharts, and express were used to present information through pie charts, bar graphs, and interactive tables.
I identified and catalogued official Canadian government budget sources, including the federal, provincial and municipal reports, then extracted budget data from 2020 to 2025 in JSON format. Integrated the Government of Canada Open Data API via MCP servers to streamline data access and improve efficiency in data retrieval and updates.
Using Vibe coding practices in the Cursor IDE, I created a React-based component library that included reusable chart components, navigation systems, and responsive layouts optimized for both desktop and mobile devices. I also implemented the six core pages and established proper routing using React Router to ensure a seamless and intuitive user experience. I use REST API endpoints to serve budget data from JSON files.
Testing
Google Lighthouse was used to evaluate performance, accessibility, and SEO and generate a detailed report. The mobile test result can be found at https://shorturl.at/wpI9i, and the desktop test result is available at https://shorturl.at/ACBfI. I used the Wave accessibility tool and GTMetrix for testing. The two platforms show no structural and contrast errors. The accessibility impact (AIM) was 9.9/10. On GTMetrix, performance shows 100% and structure displays 99%.
Moodboard

The Civic Lens moodboard shows a focus on finances and data. The images of charts, laptops, and money reflect analysis, transparency, and real economic insights. The colour palette—deep blue, orange, and light blue—suggests trust, clarity, and energy. The simple icons and modern fonts (Montserrat and Poppins) keep the design minimal and easy to read. Overall, the mood board shows a data-driven platform that makes complex financial information clear and accessible.
Brand Collections
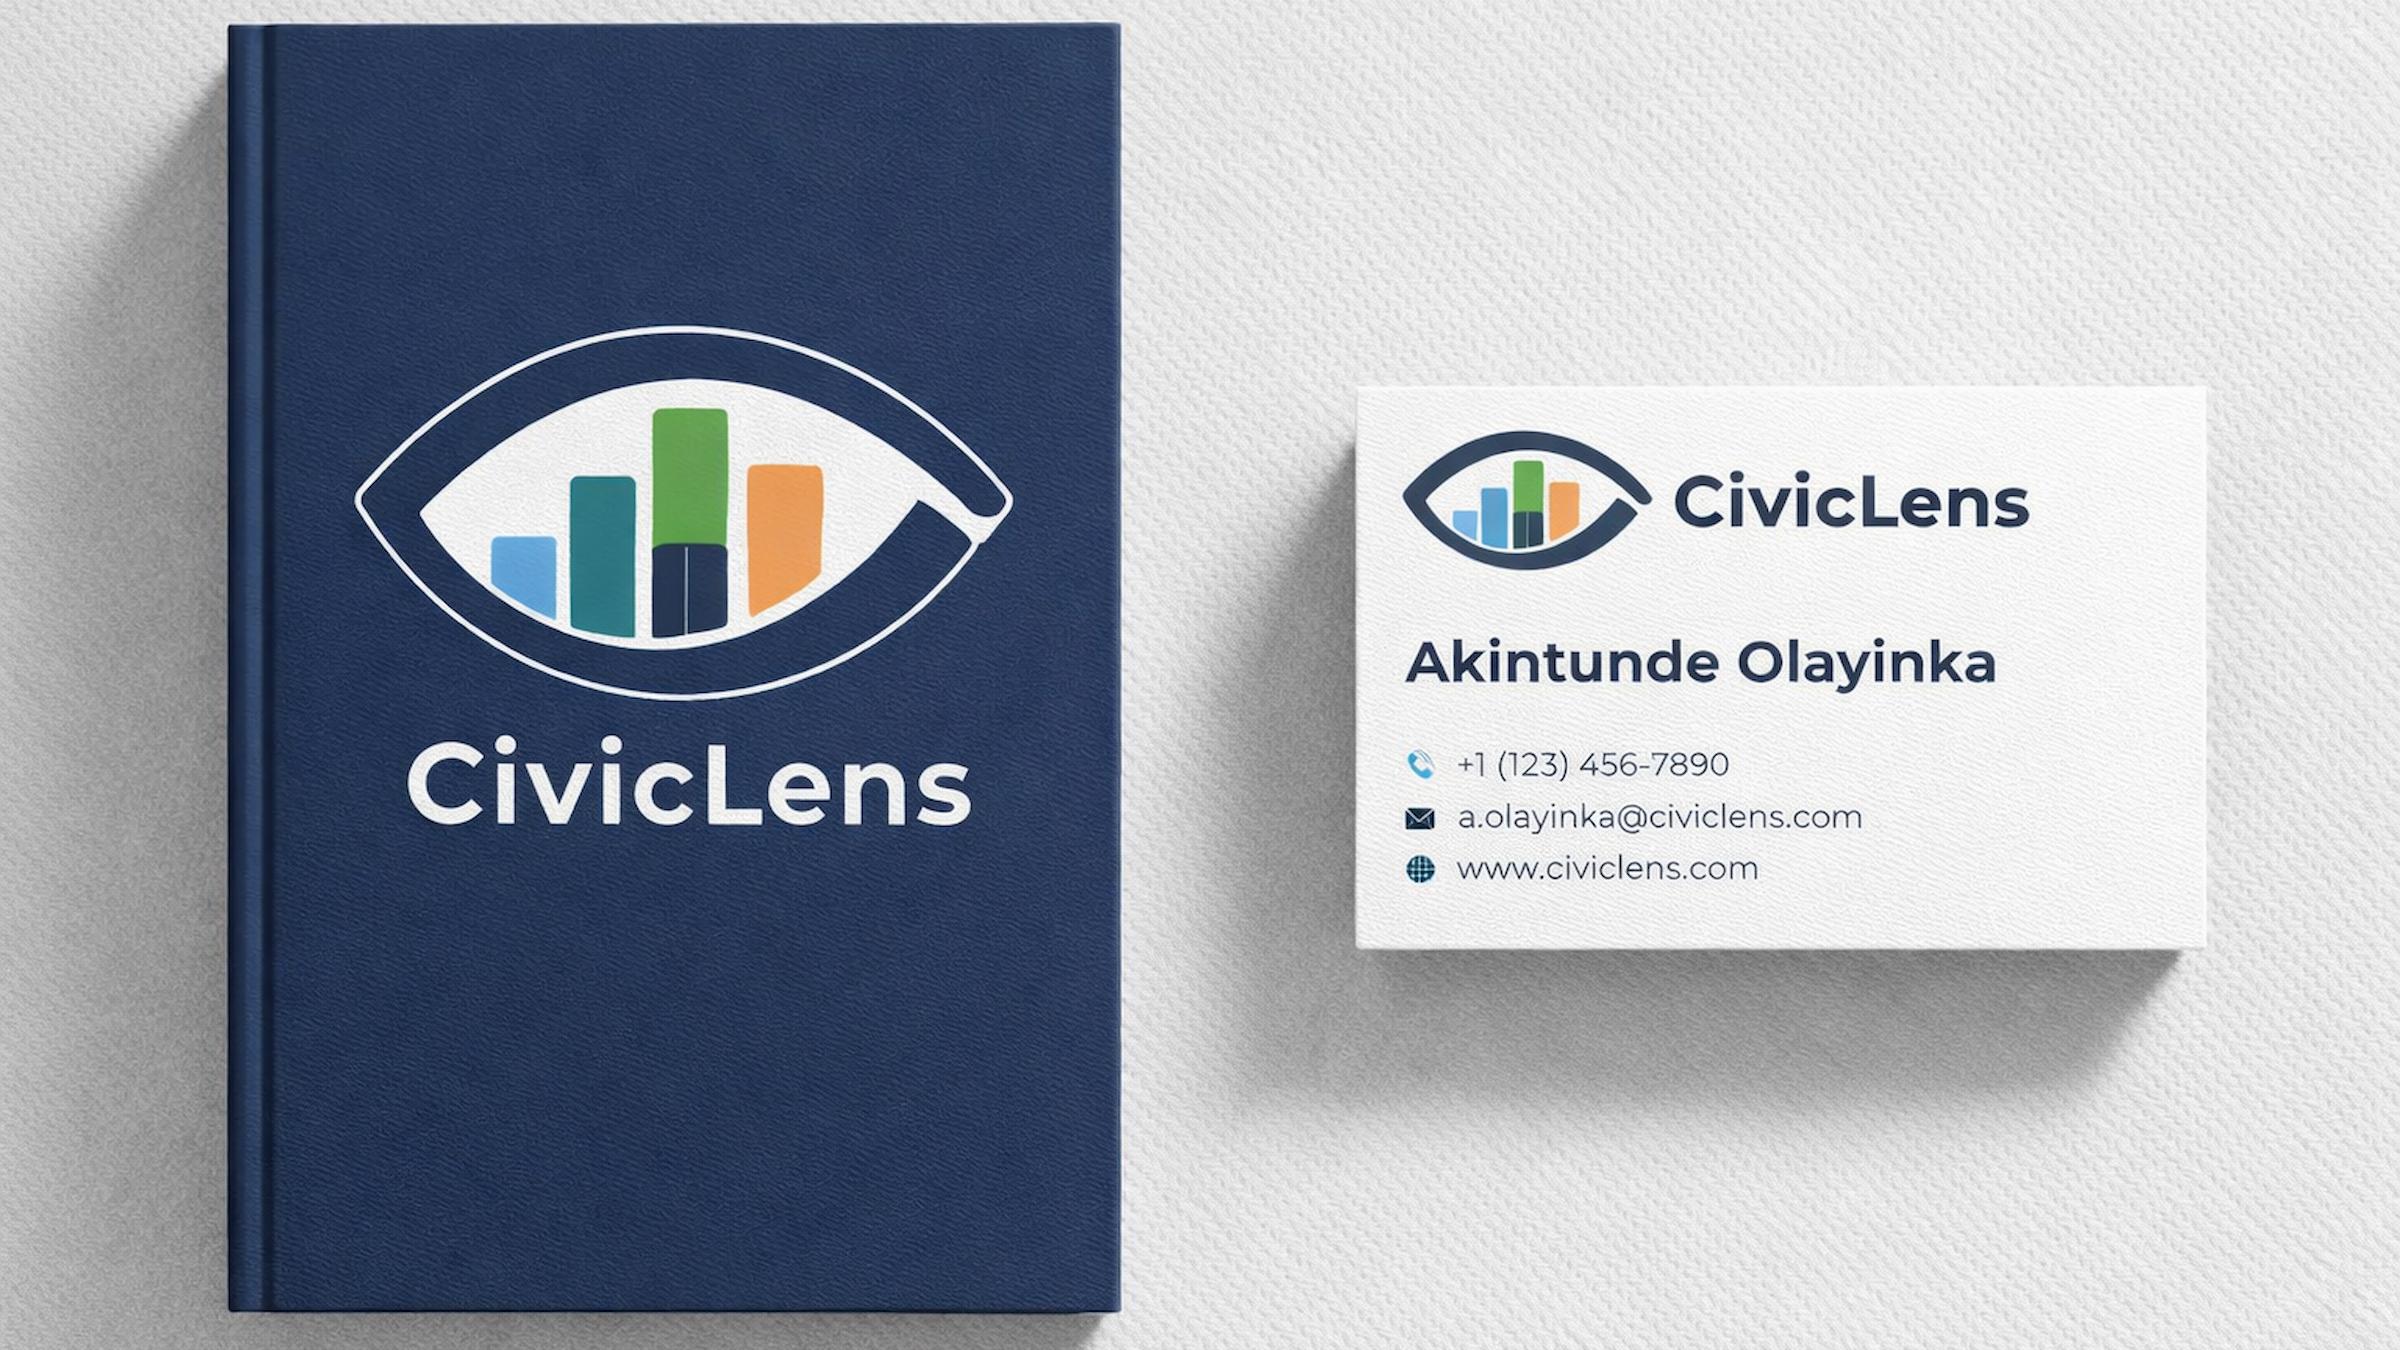
To create a brand for Civic Lens, I created a visual identity that shows the brand solution at a glance. For uniqueness, I made a creative logo, a sample of a business ID card, and a company jotter that will serve as event giveaways.
With inspiration from the brand name itself, I placed charts in an eye lens shape. Doing these tasks shows everyone’s eyes are on the budget and demonstrates users’ interest. After various logo idea options, I settled for what I have now.
However, the logo’s colours are part of the palette used in this project to avoid colour contrast issues.