
Clean Wave
CleanWave is a web-based platform designed to connect volunteers and organizations to support environmental cleanup efforts across Vancouver Island. The idea was inspired by witnessing the growing impact of human waste on nature, particularly in rivers and oceans, where pollution harms wildlife and ecosystems. One personal experience, seeing large metal structures being removed from a blocked river to restore its natural flow, sparked the vision of creating a community-driven solution to protect and restore the environment.
Through research into existing volunteer platforms and discussions with local organizations in the Comox Valley, I identified a gap: most platforms only serve individual organizations, with no centralized space to discover multiple environmental initiatives. CleanWave addresses this by providing a unified platform where volunteers can easily find and join cleanup events. The project was designed and prototyped in Figma, focusing on accessibility, clarity, and user engagement.
Check out the project on Figma.
Problem and Research
The starting point of this project was understanding why environmental cleanup initiatives often struggle to attract consistent participation. While many people care about the environment, there is often a disconnect between intention and action.
Through initial research, I explored how environmental organizations promote their events and how volunteers typically discover them. I reviewed websites from local initiatives around Vancouver Island and observed that most platforms are designed for a single organization. This creates fragmentation-users need to visit multiple websites or social media pages to find opportunities.
I also looked into how environmental issues are communicated. Many platforms rely heavily on statistics or long descriptions, which can feel distant or overwhelming. I wanted to explore a more engaging approach, one that makes the impact feel immediate and personal.
A key insight from this phase was that accessibility and awareness are the main barriers. People are willing to help, but they need a simple and centralized way to get involved.
Defining the Solution
Based on my research, I defined the core idea of CleanWave: a community that connects volunteers with multiple environmental cleanup events in one place.
The primary user group is volunteers, while organizations act as administrators who create and manage events. This decision helped simplify the scope and allowed me to focus on the most important user journey.
I mapped out the user flow starting from landing on the homepage to successfully joining an event. The goal was to make this process as smooth as possible, reducing unnecessary steps and friction.
At this stage, one challenge was deciding how much functionality to include. I initially considered features like messaging systems and advanced filtering, but I realized these would complicate the experience. Instead, I focused on essential actions: discovering events, viewing details, and signing up.
Wireframing and Structure
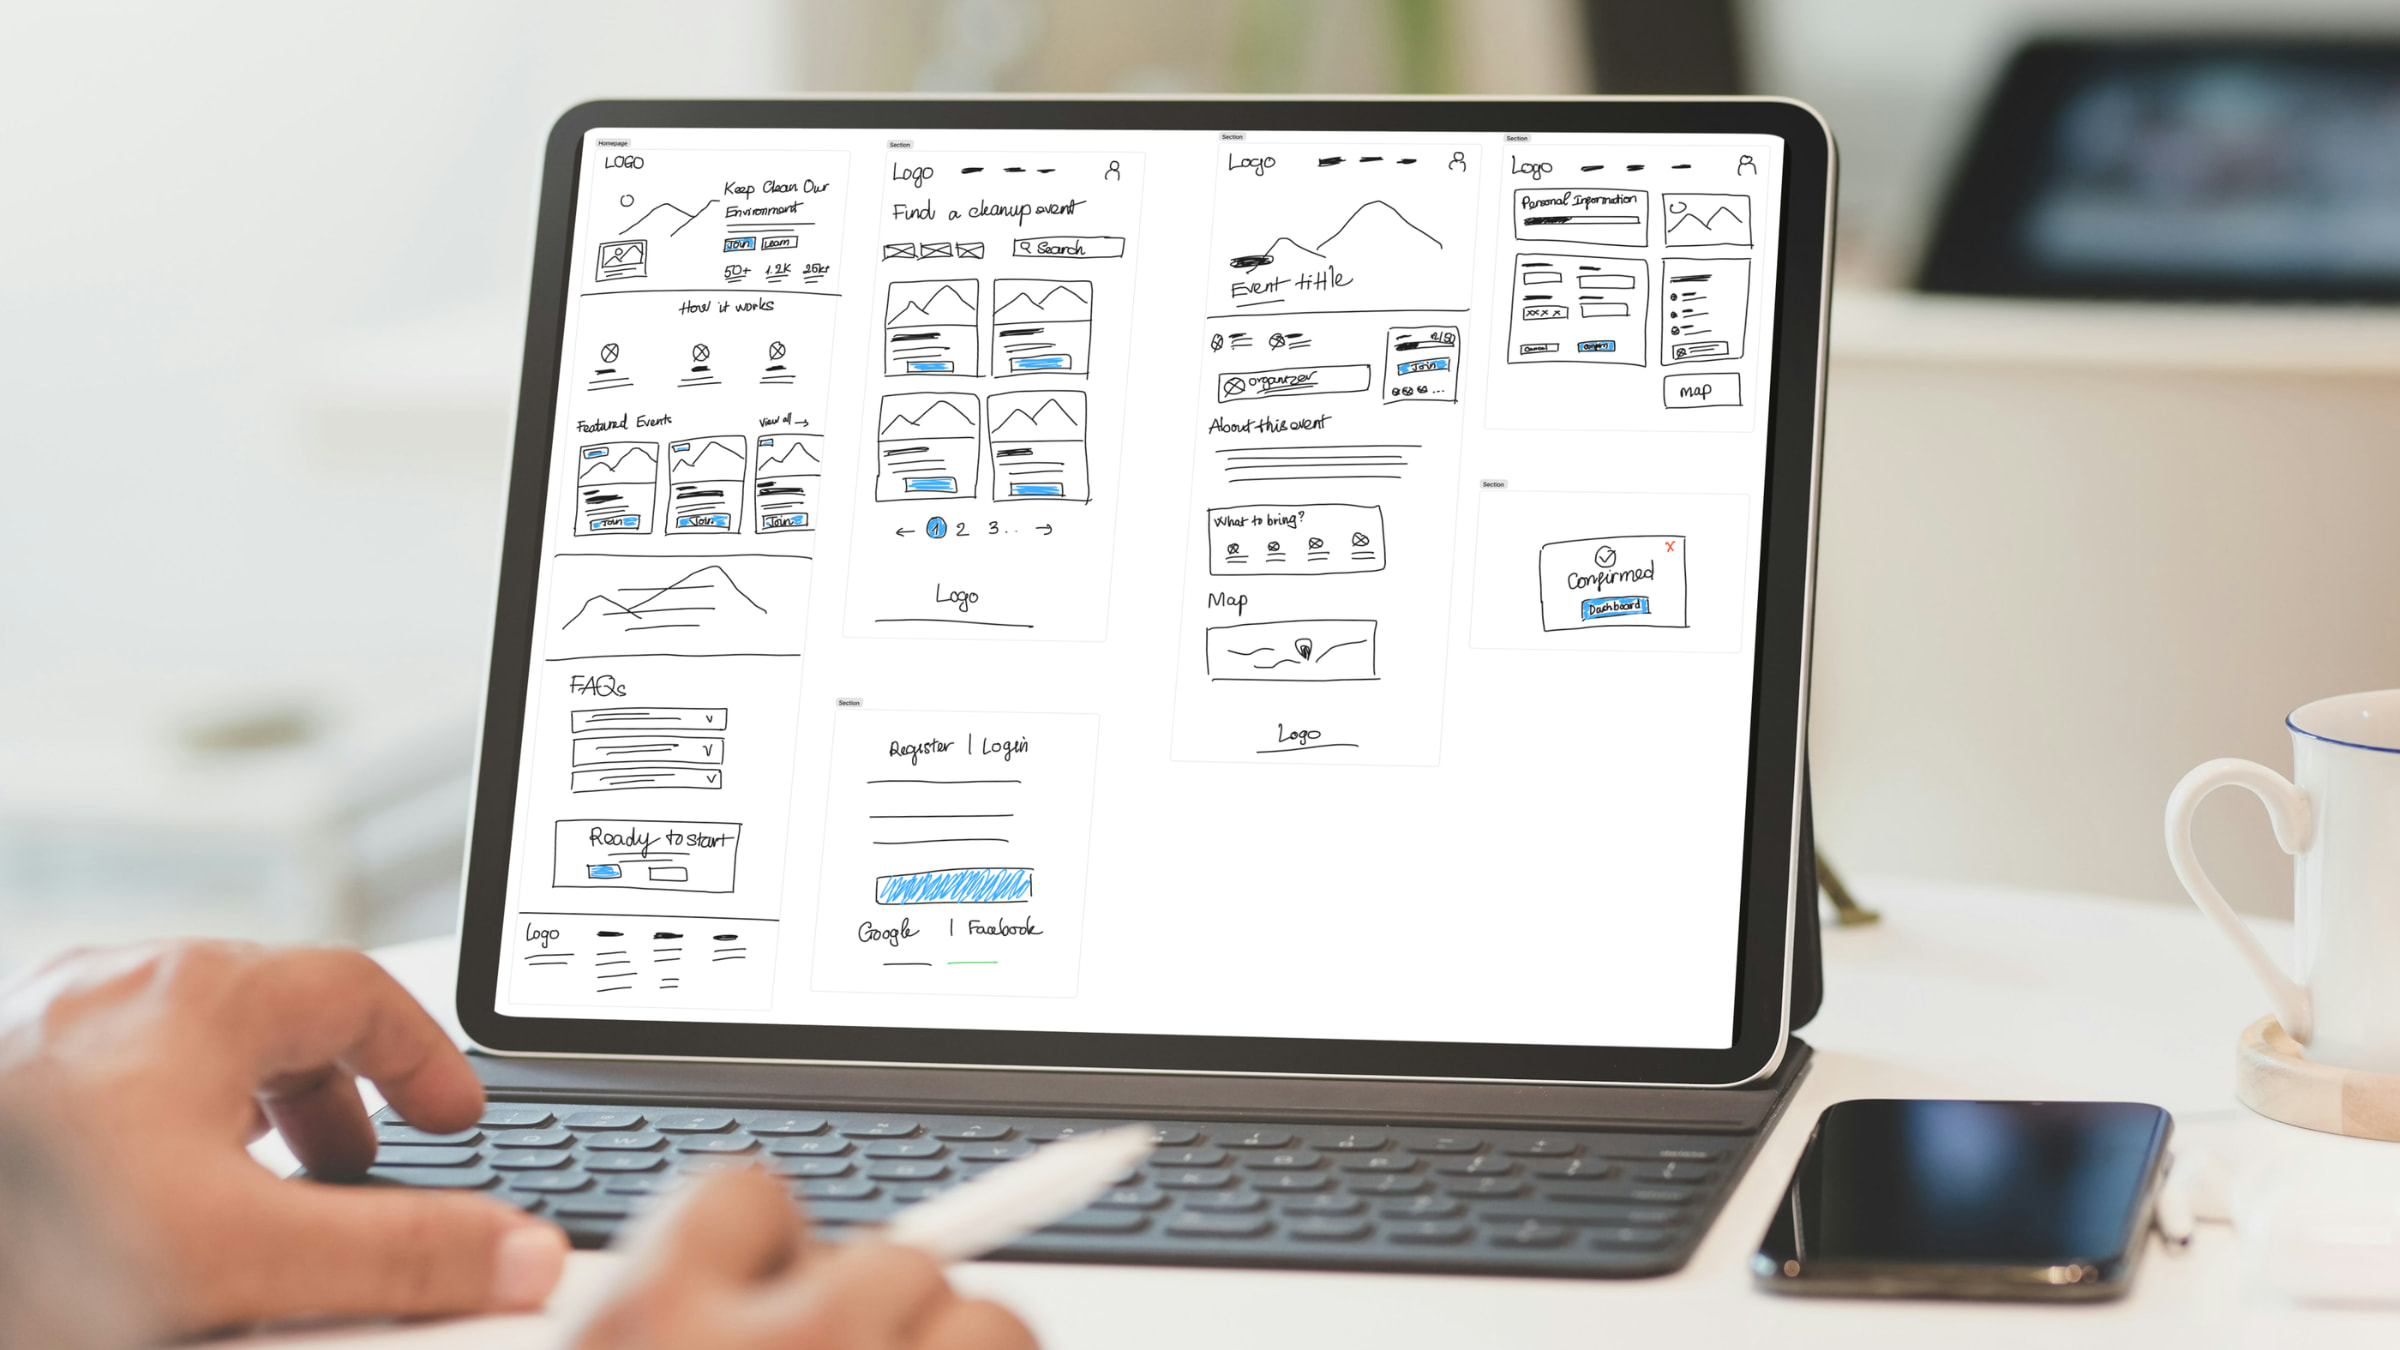
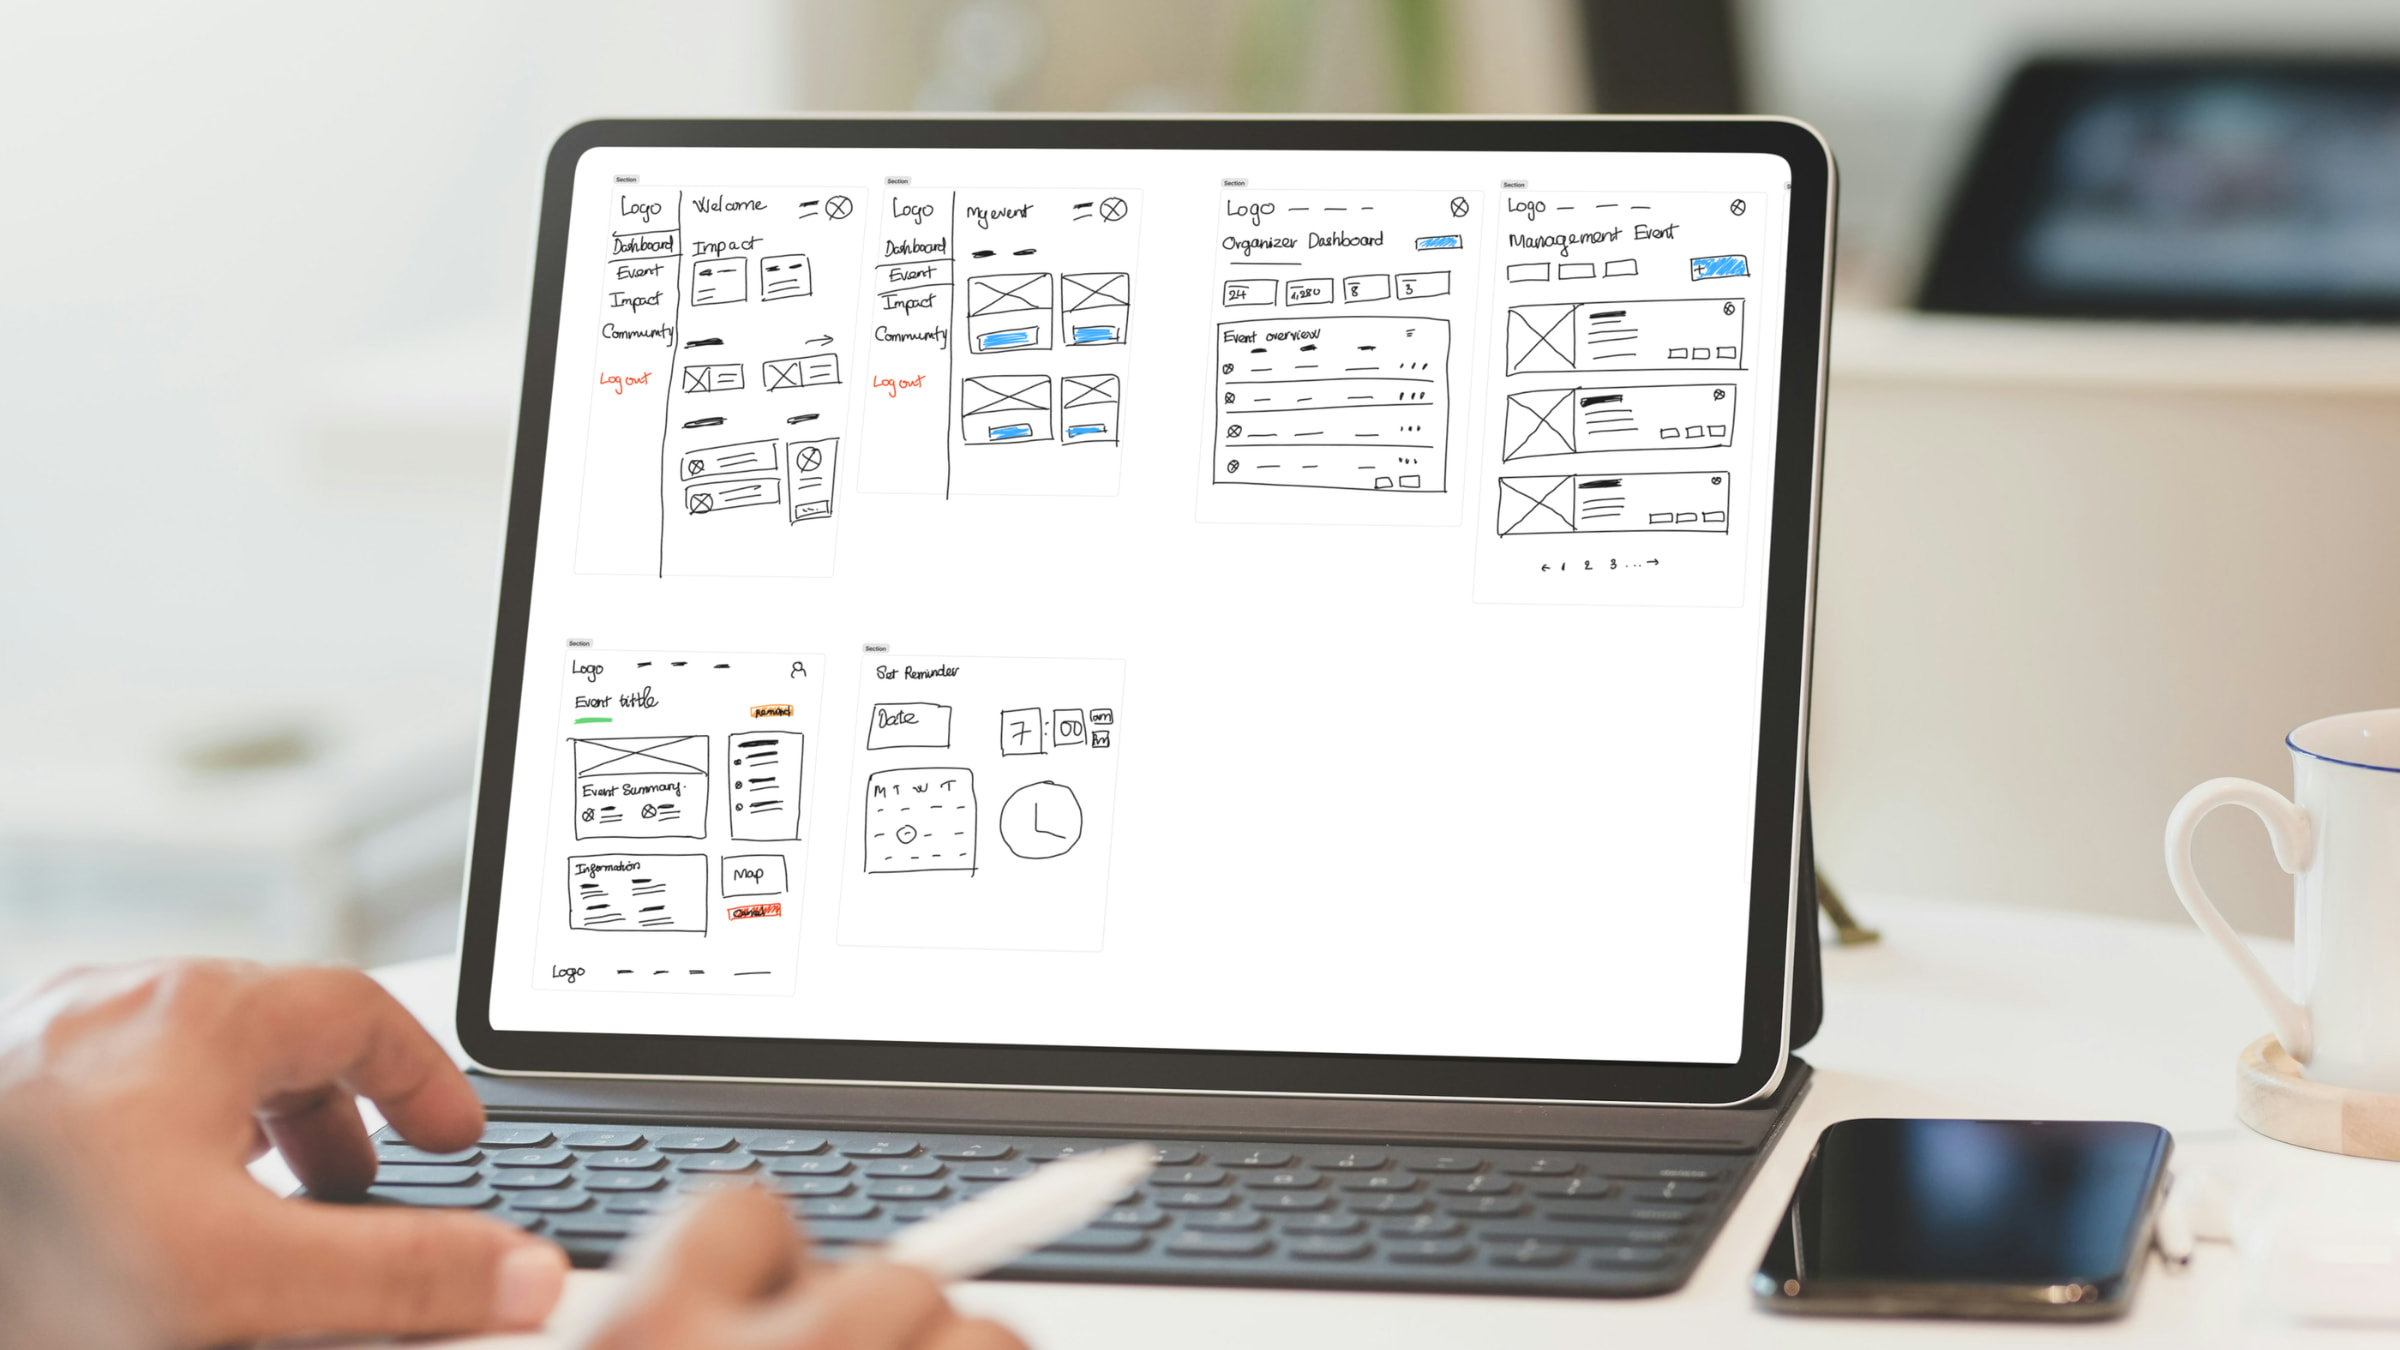
I began translating ideas into low-fidelity wireframes to establish layout and structure.
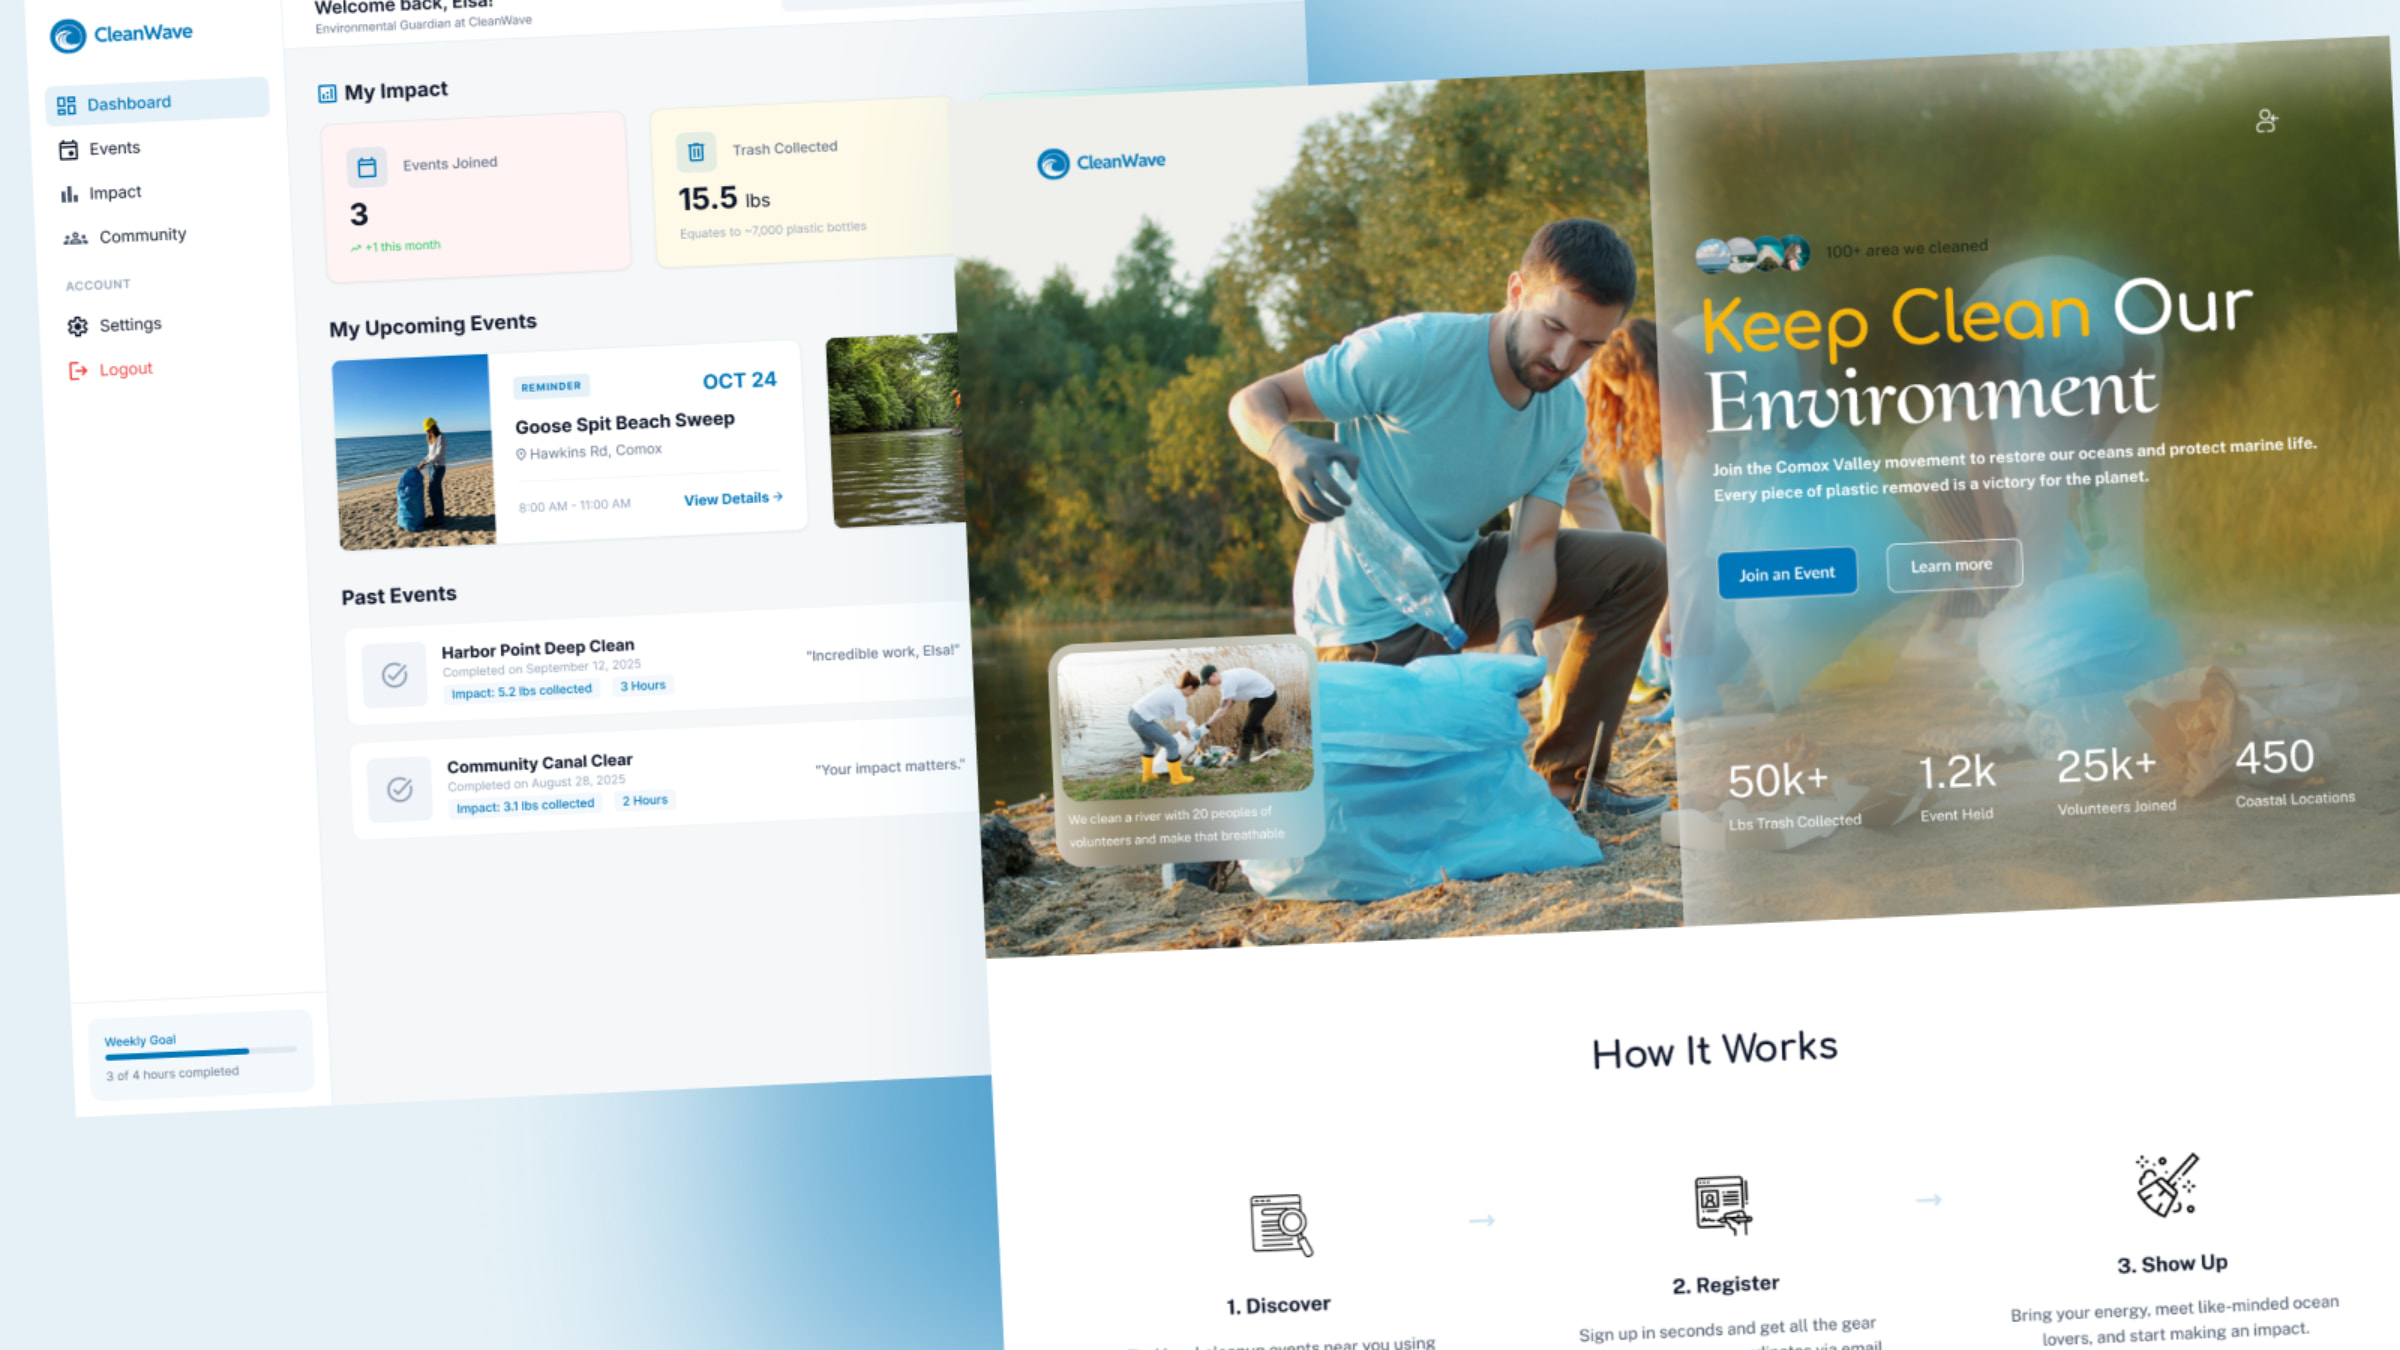
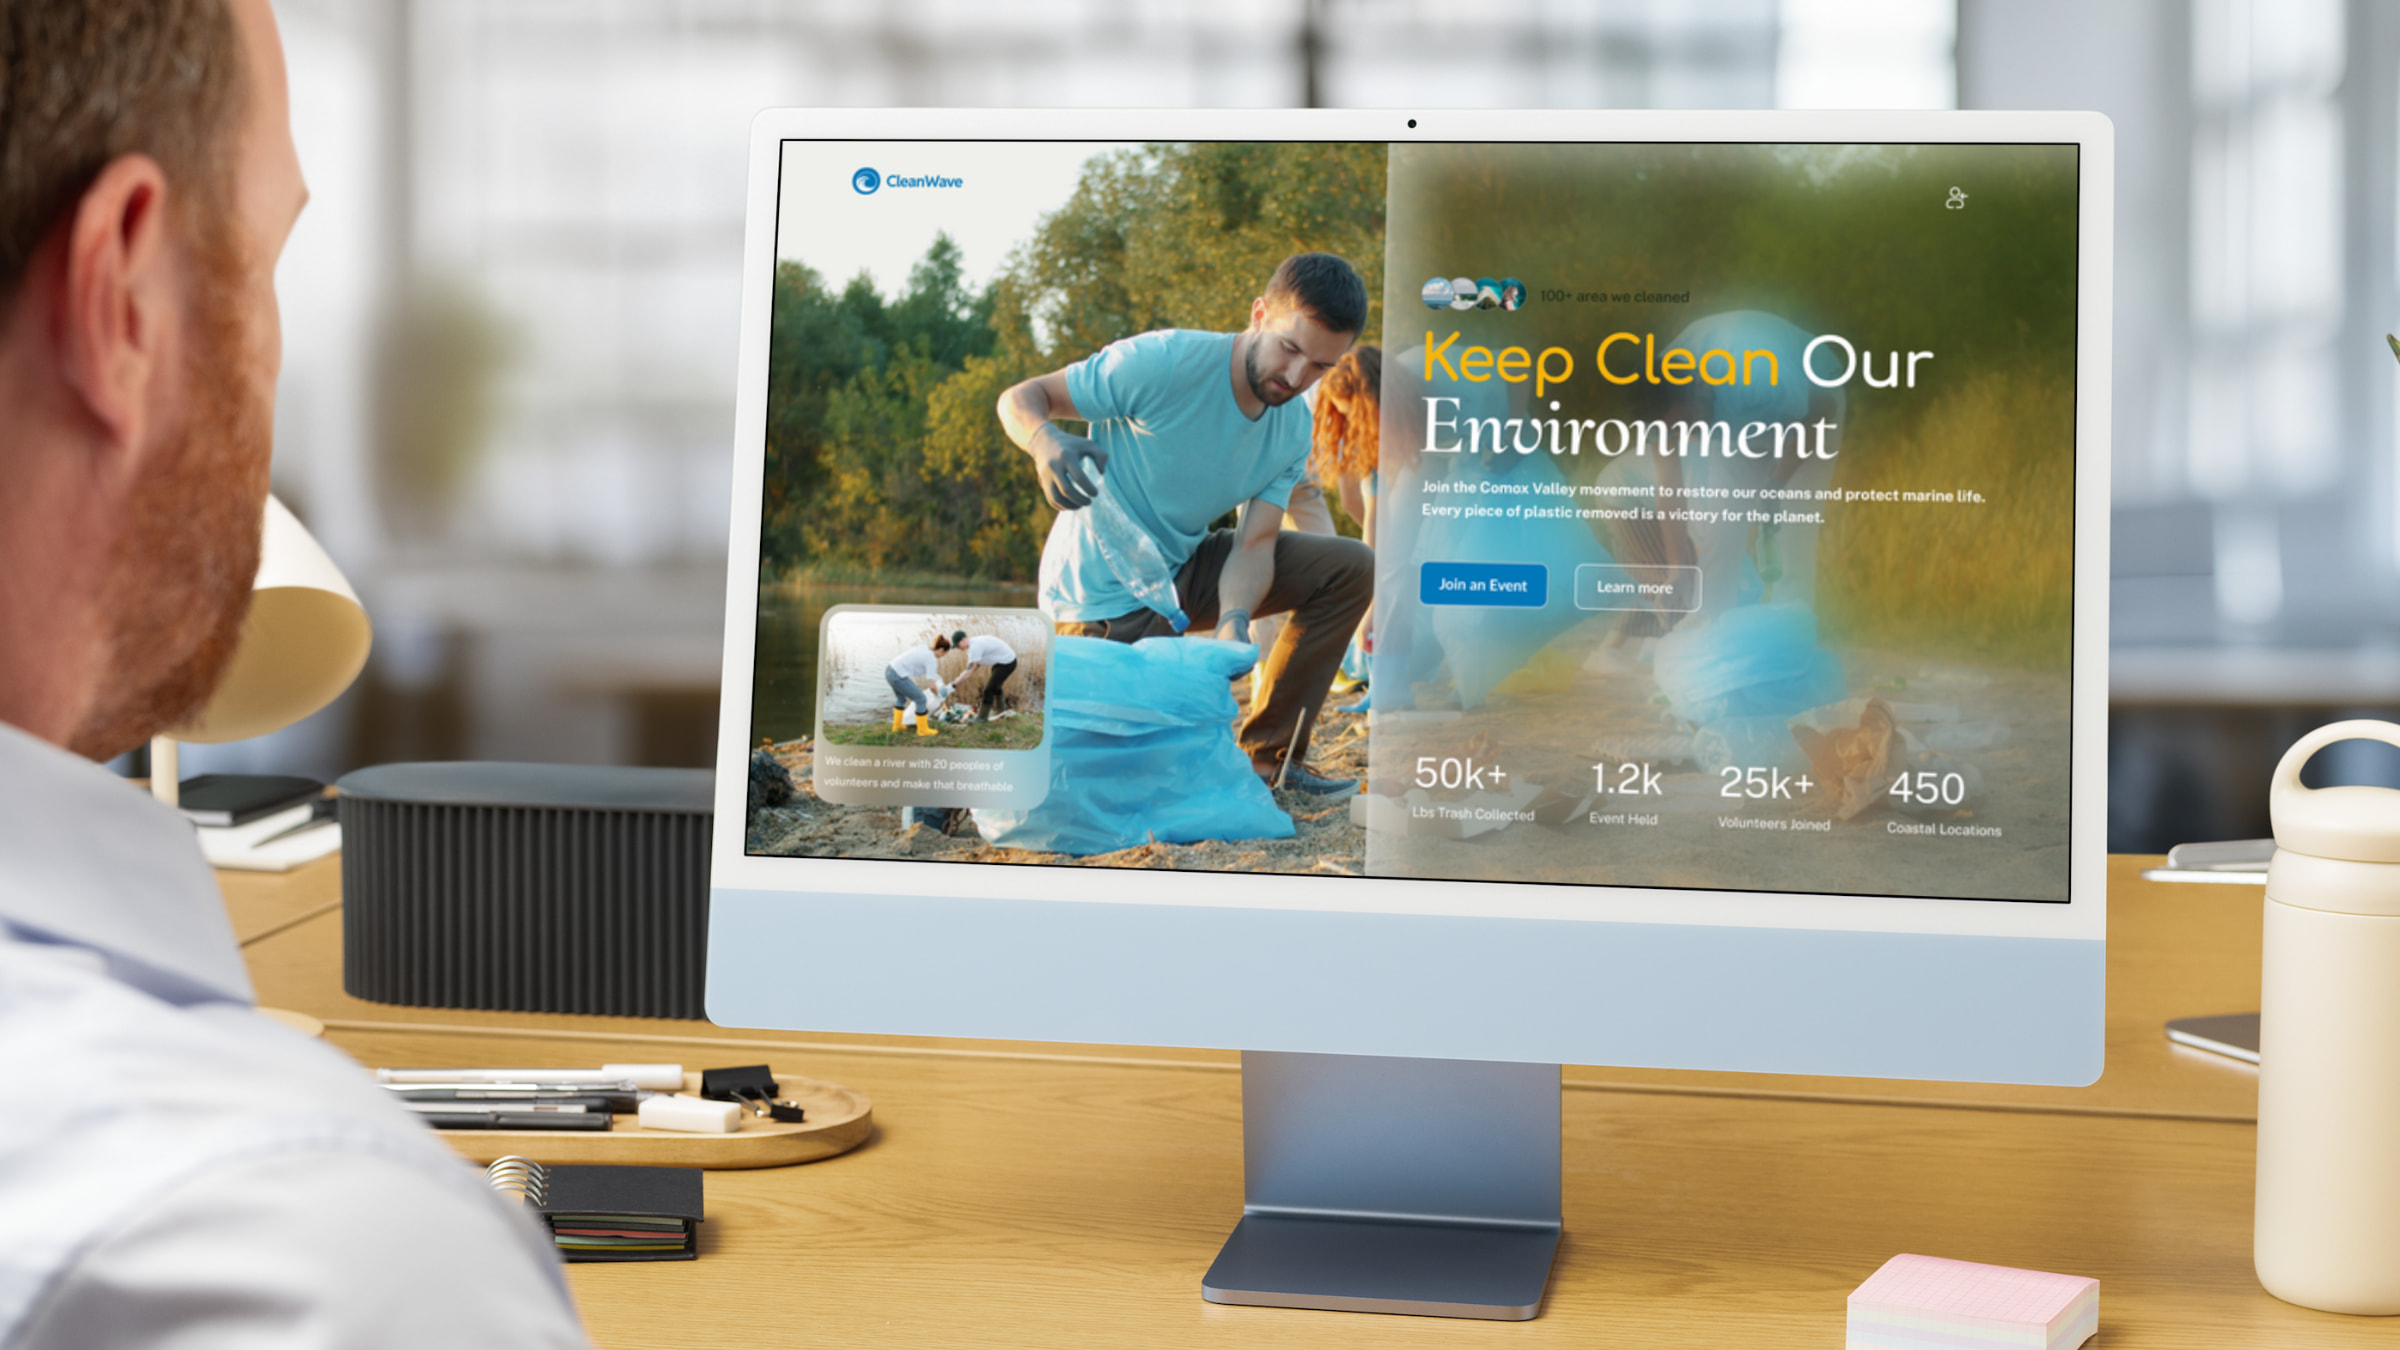
The homepage was designed to immediately communicate the purpose of the platform. It includes a strong hero section, a clear call-to-action, and visual indicators of environmental impact. I wanted users to quickly understand what CleanWave is and how they can participate.
The event page focuses on clarity and usability. Important information such as location, date, and description is presented in a structured way, with a clear sign-up action.
During this phase, I encountered an issue with information overload. Early versions of the design included too much text and too many elements competing for attention. I addressed this by simplifying the layout and prioritizing the most important content, improving readability and flow.
Check out the wireframes on Figjam.
Visual Design
With the structure in place, I moved on to visual design. The goal was to create a clean and approachable interface that reflects environmental values without feeling overly complex.
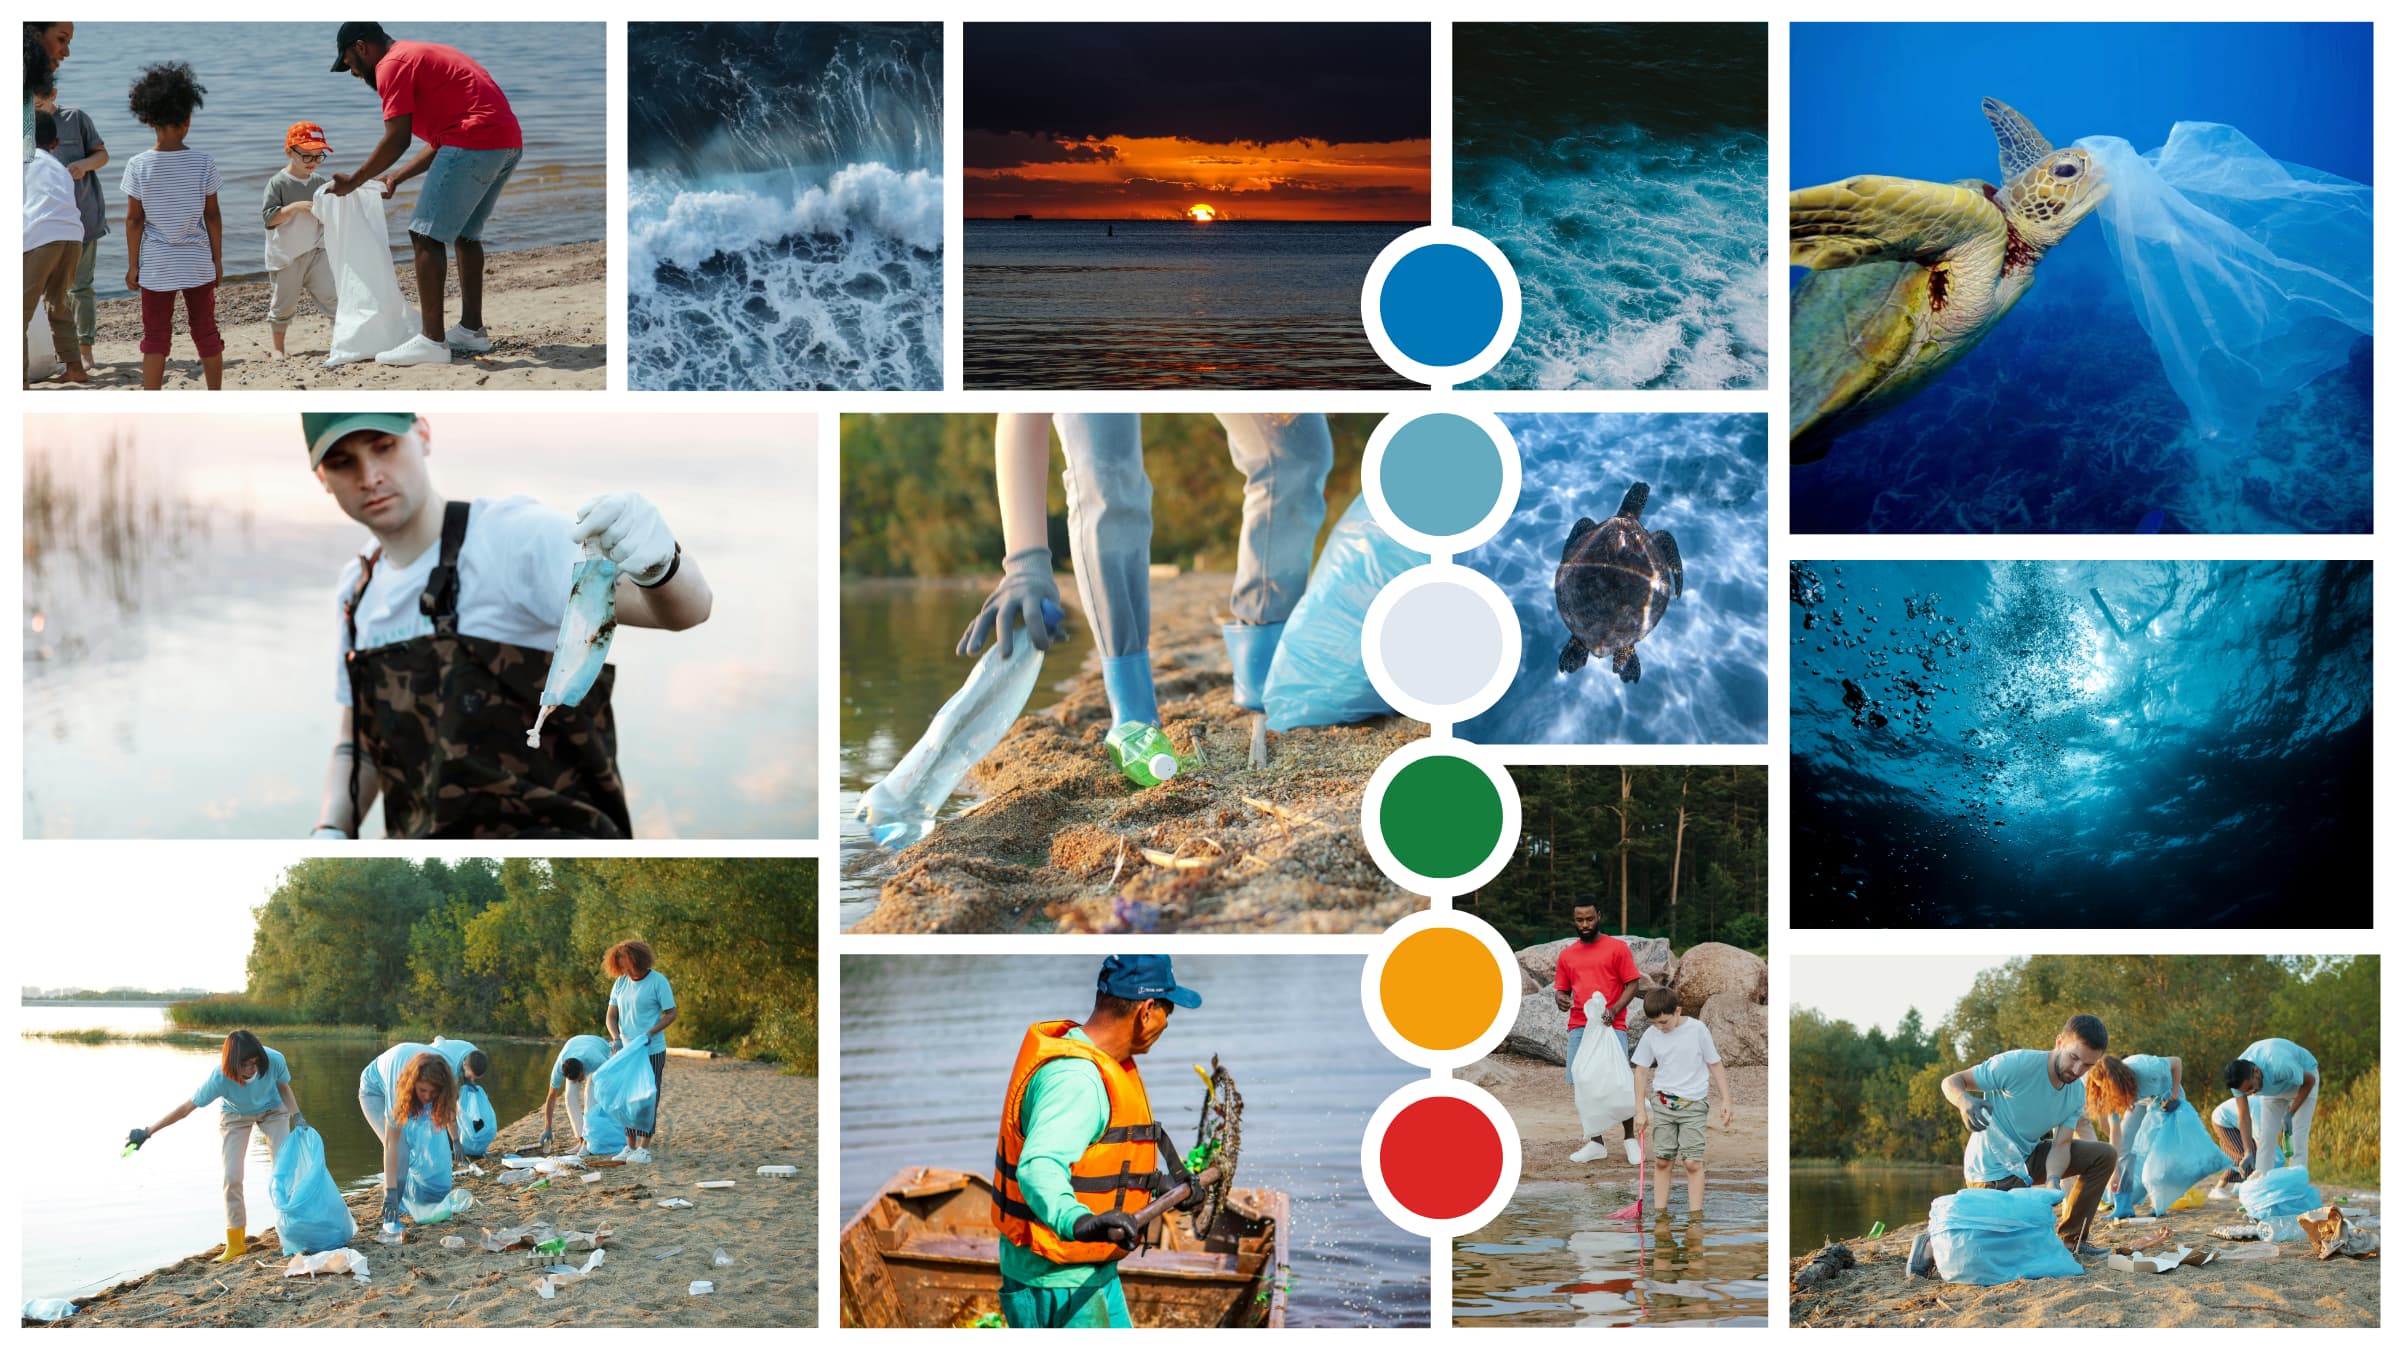
I used a simple color system based on the 60-30-10 rule. Neutral tones form the base of the interface, while blue and green are used to represent trust and environmental themes. This balance helps create a calm and modern aesthetic.
Typography was selected to ensure readability across devices, with clear hierarchy between headings, body text, and interactive elements.
One challenge during this stage was maintaining visual consistency. As more components were added, it became important to standardize spacing, colors, and typography. Creating a basic design system helped ensure consistency across all screens.
Prototype and Interaction
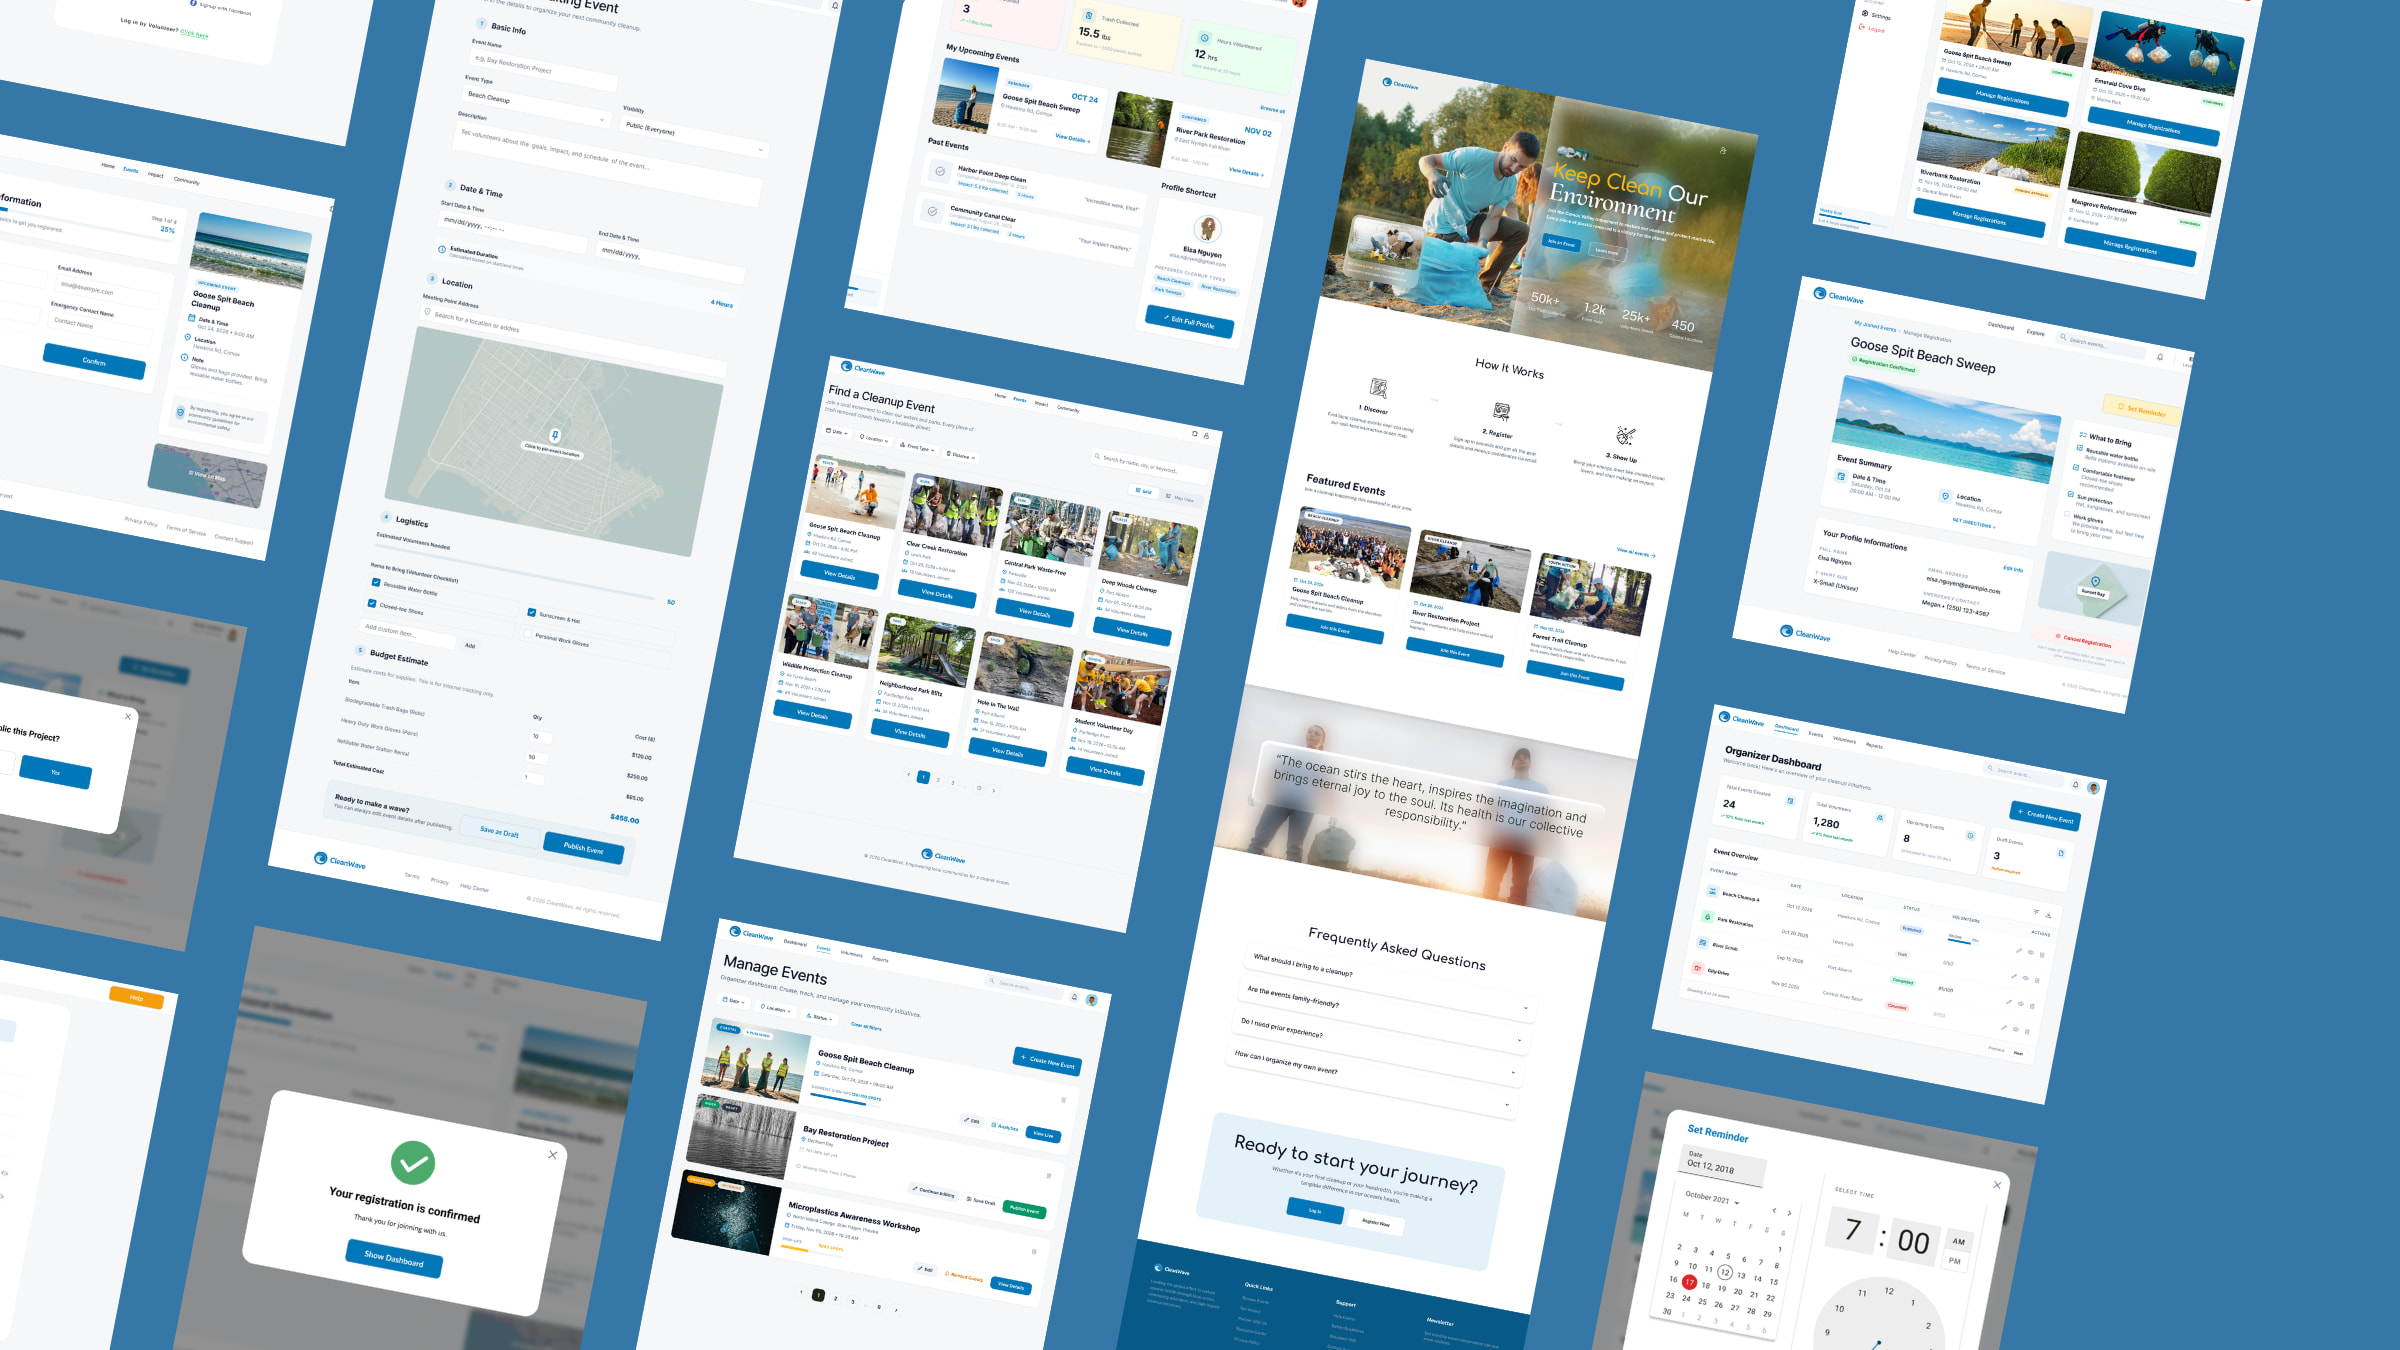
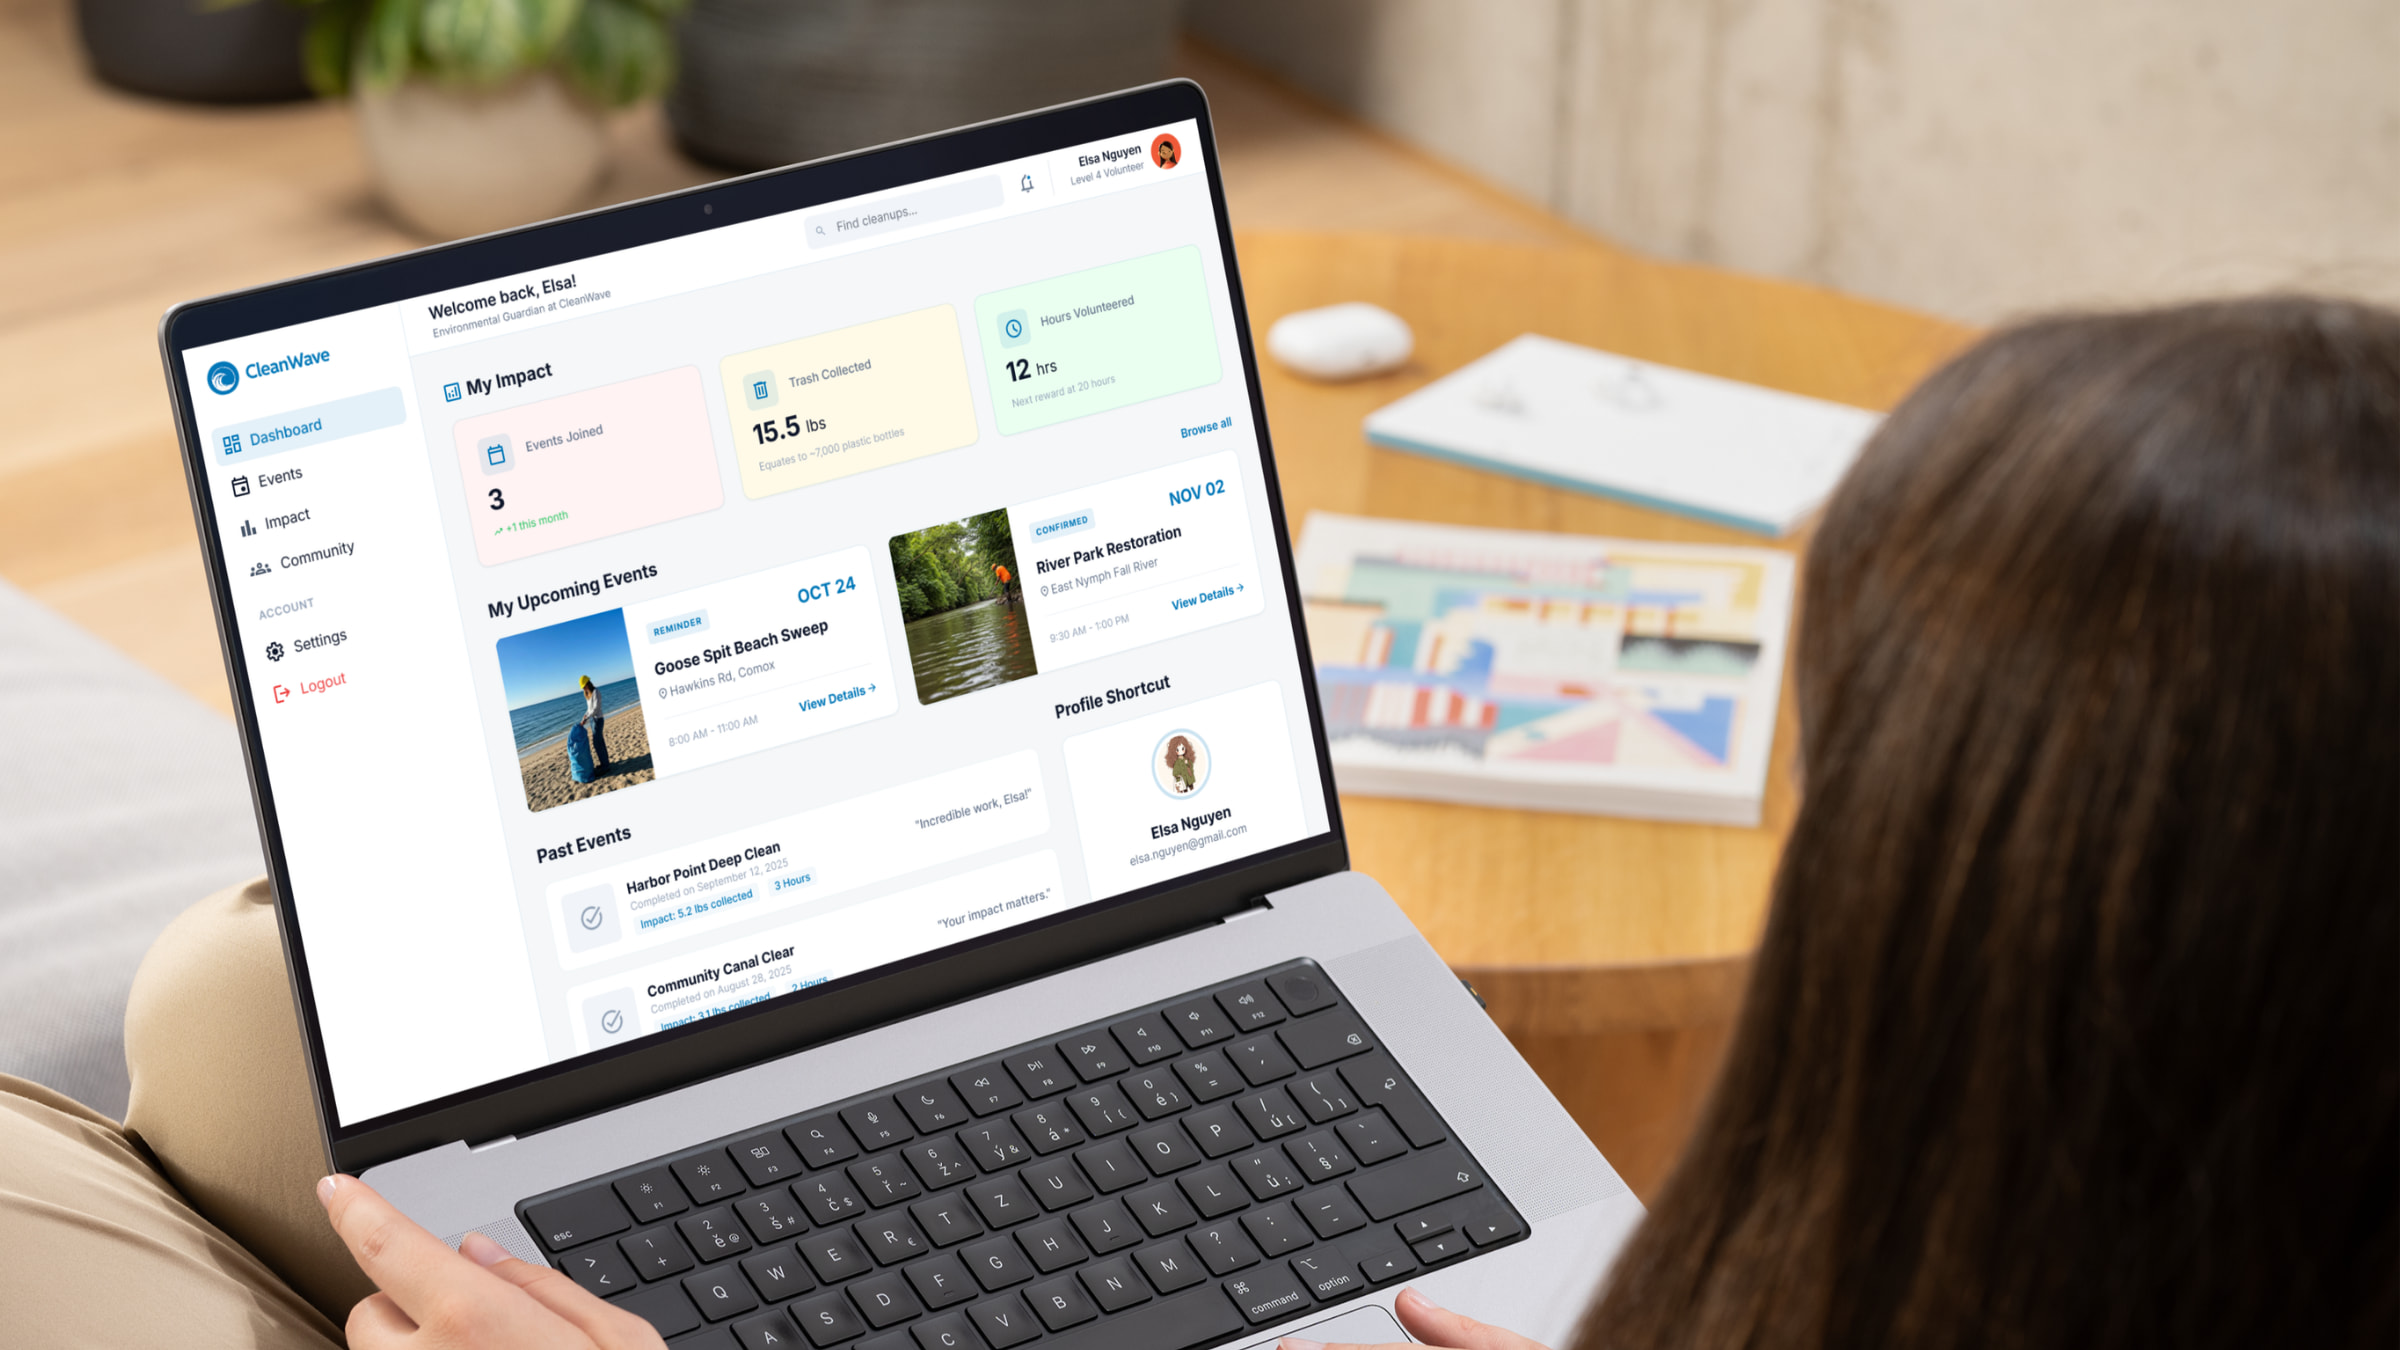
After finalizing the visual design, I built a high-fidelity prototype in Figma to simulate the user experience.
The prototype includes key interactions such as browsing events, viewing details, and completing the sign-up process. I also added micro-interactions, such as hover states and button feedback, to make the interface feel more responsive and intuitive.
One of the main challenges during this phase was ensuring that the experience remained simple while still feeling engaging. I avoided adding unnecessary animations and focused instead on clarity and usability.
Testing the prototype helped me identify small usability issues, such as unclear button labels and spacing inconsistencies. These were refined to improve the overall flow
Solution
The final solution is a centralized platform that simplifies how people discover and participate in environmental cleanup events.
CleanWave allows users to easily browse events, understand their impact, and sign up without unnecessary complexity. By bringing multiple organizations into one platform, it removes the need for users to search across different sources.
The design focuses on clarity, accessibility, and motivation-encouraging users to take action and engage with their community. Visual elements that highlight environmental impact also help create a stronger emotional connection, encouraging users to take action.